
Volatility grows again
16 June de 2022

The first half of June has again brought increased volatility with further corrections. Inflation data in the United States (8.6% year-on-year in May) and a new lockdown in China, which is once again threatening supply chains, are fuelling fears about the global economy. Investors are beginning to question whether the US Federal Reserve (FED) is doing enough to avoid entering a stagflation scenario (high inflation and very low economic growth). With the start of QT (quantitative tightening), the FED will start selling assets off its balance sheet, withdrawing part of the liquidity it has injected into the market over the last 2 years.
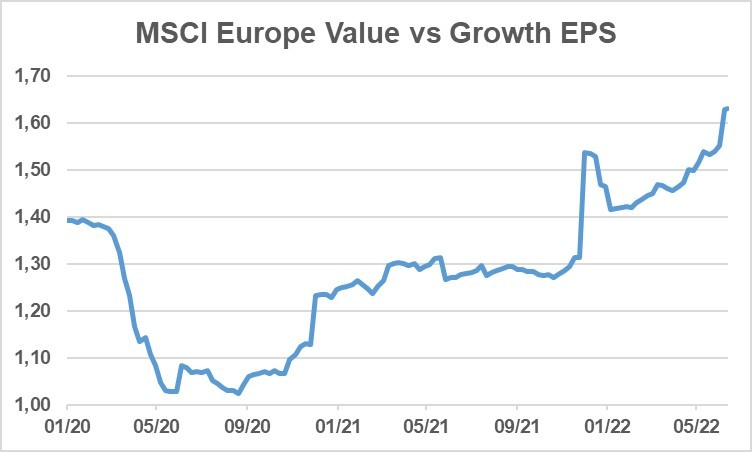
1. Value companies increase their earnings more than growth companies
This paradox is explained by the very functioning of the capitalist economy. When certain sectors have been neglected by investors, these sectors find it difficult to raise capital to undertake the necessary investments, which has an impact on the supply of these sectors and, consequently, the prices and profitability of their companies increase. This explains much of the strong performance of many value companies, such as energy and commodity companies. Such cycles are common and do not imply that the trend will continue in aeternum, as the recent strong performance of value companies will, sooner or later, come to an end, lower their cost of capital and may eventually translate into increased supply in these sectors. However, the fact that they continue to trade at a discount above the historical average in comparison to growth companies and that we are not seeing an increase in investment leads us to believe that value companies should continue to do better in the medium term.
Graph 1: Earnings per share of European value vs. growth companies
2. Yield curves continue to steepen
Since our last bi-weekly analysis, the US yield curve has steepened again to 3.20% in the 10-year term. The shorter parts of the curve have steepened even further, leading to a very noticeable flattening with a 75 bp rate hike in sight. In Europe, the movement has been even more marked, with the German Bund rebounding by almost 50 bp to 1.5% in just two weeks. In this case, the speech by the chairman of the European Central Bank, in which she expected an initial rate hike next month and, furthermore, did not rule out a 50 bp hike in September, has made the market nervous.
3. Sentiment remains very negative, wich is a good oposite signal
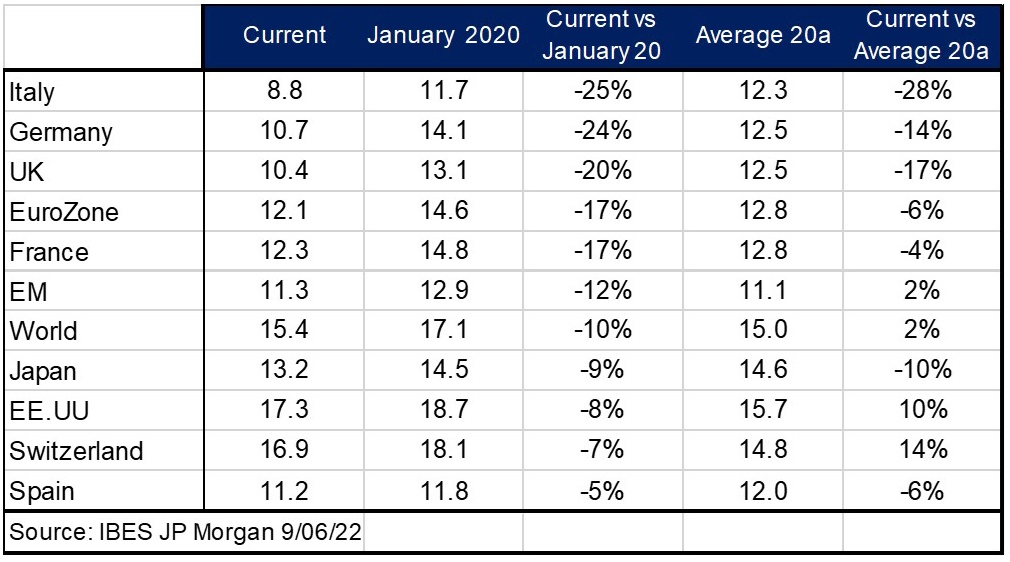
Several market sentiment indicators are at pessimistic or extremely pessimistic levels, such as the University of Michigan’s consumer sentiment index, which is at its lowest level since the 1980s. It is common for such low levels of sentiment to coincide with market lows; after all, the poor outlook conditions market decisions, which then reflect the worst macroeconomic scenario in asset prices. Without knowing whether or not markets are likely to correct further, we believe that the outlook for the future performance of many assets has improved significantly so far this year. A good example is equity. The current valuation of the various indices is trading lower than pre-COVID levels in January 2020, and in virtually all cases, below historical valuation levels. We find this an excellent starting point for an asset that is a long-term winner and that we can currently buy at prices below historical averages.
Table 1: 12m Fwd PER by geographical area
#MoraBancExperts
